October 26, 2023
This article highlights how SeerAI’s platform, Geodesic, simplifies and accelerates complex data analysis workflows while reducing costs, all without the need to ETL or move large datasets. Geodesic leverages our innovative computation engine, Tesseract, to achieve this feat. To access and utilize the data within Tesseract, we employ our Data Mesh tool, Boson. Boson’s innovative design connects virtually any data source in any format and location (AWS S3, SQL, NoSQL, Microsoft Planetary Computer, Azure Blob, Google Earth Engine, etc…) and seamlessly exposes the data to Tesseract. Once a data set is connected with Boson it creates a reference within Geodesic’s Knowledge Graph. These references store vital information about data location, accessibility, structure, and its potential applications. This streamlined approach enables the Tesseract Computation Engine to efficiently retrieve and process data at scale, significantly outpacing the performance of the current state of the practice applications and workflows.
In showcasing the capabilities of Tesseract, we delve into the application of harmonic regression—a widely employed technique in the fields of forestry and agriculture for time series analysis. Harmonic regression seeks out temporal patterns that exhibit consistent repetition over defined time intervals, such as yearly cycles. This powerful method isn’t limited to vegetation analysis; it can also be employed to discern trends within spectral data patterns and make predictive projections for applications like vegetation management, forest health assessment, and land cover modeling. The integration of this workflow within Geodesic is poised to significantly enhance our comprehension of environmental impacts, making it invaluable for Environmental, Social, and Governance (ESG) initiatives and carbon capture projects. Furthermore, it aids organizations like the US Forest Service in monitoring the health and seasonal fluctuations of forest inventories. While often associated with vegetation, Geodesics harmonic regression engine is a versatile tool capable of modeling any temporal pattern to optimize resource allocation, understand supply chain dependencies, and predict future outcomes.
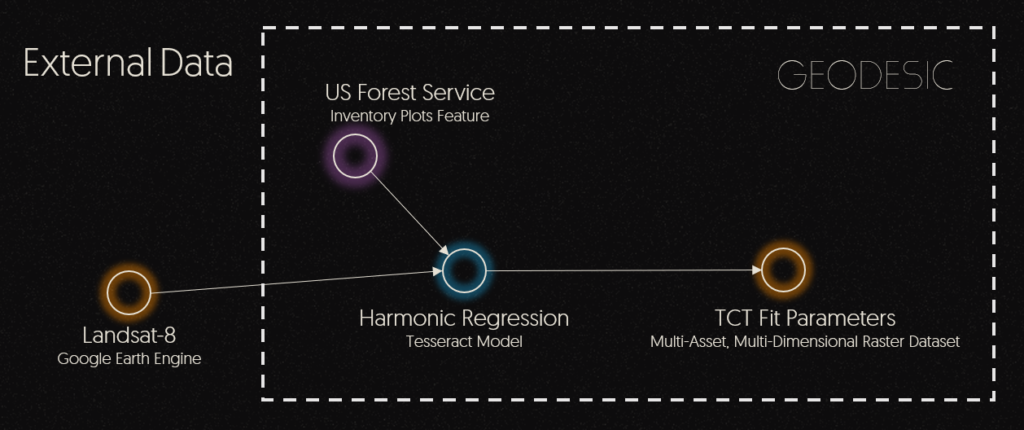
In this example we will fit a Fourier series to Landsat-8 data using the Geodesic Platform. The Landsat data is located on Google Earth Engine and we will use boson to add it to the Geodesic Knowledge Graph which will allow the Tesseract Computation Engine to reach out and gather the data, then process it at scale. In the modeling step we first transform the first 6 spectral bands of Landsat data with the Tasseled Cap Transformation (TCT). This takes the spectral bands and extracts 3 new bands from them called brightness, greenness, and wetness. We then fit an n-the order Fourier Series to the transformed data. The parameters we are looking for are the coefficients of the following series:

An example of this type of fit can be seen below. This is a simple Sine function with a linear term that has a 4th order Fourier series fit using the least squares regression method.

In reality the data is much messier than this nice Sine function. Landsat data can have clouds, bad pixels and even completely missing data. Below is an example of a Fourier series fit to this noisy, unfiltered Landsat data.
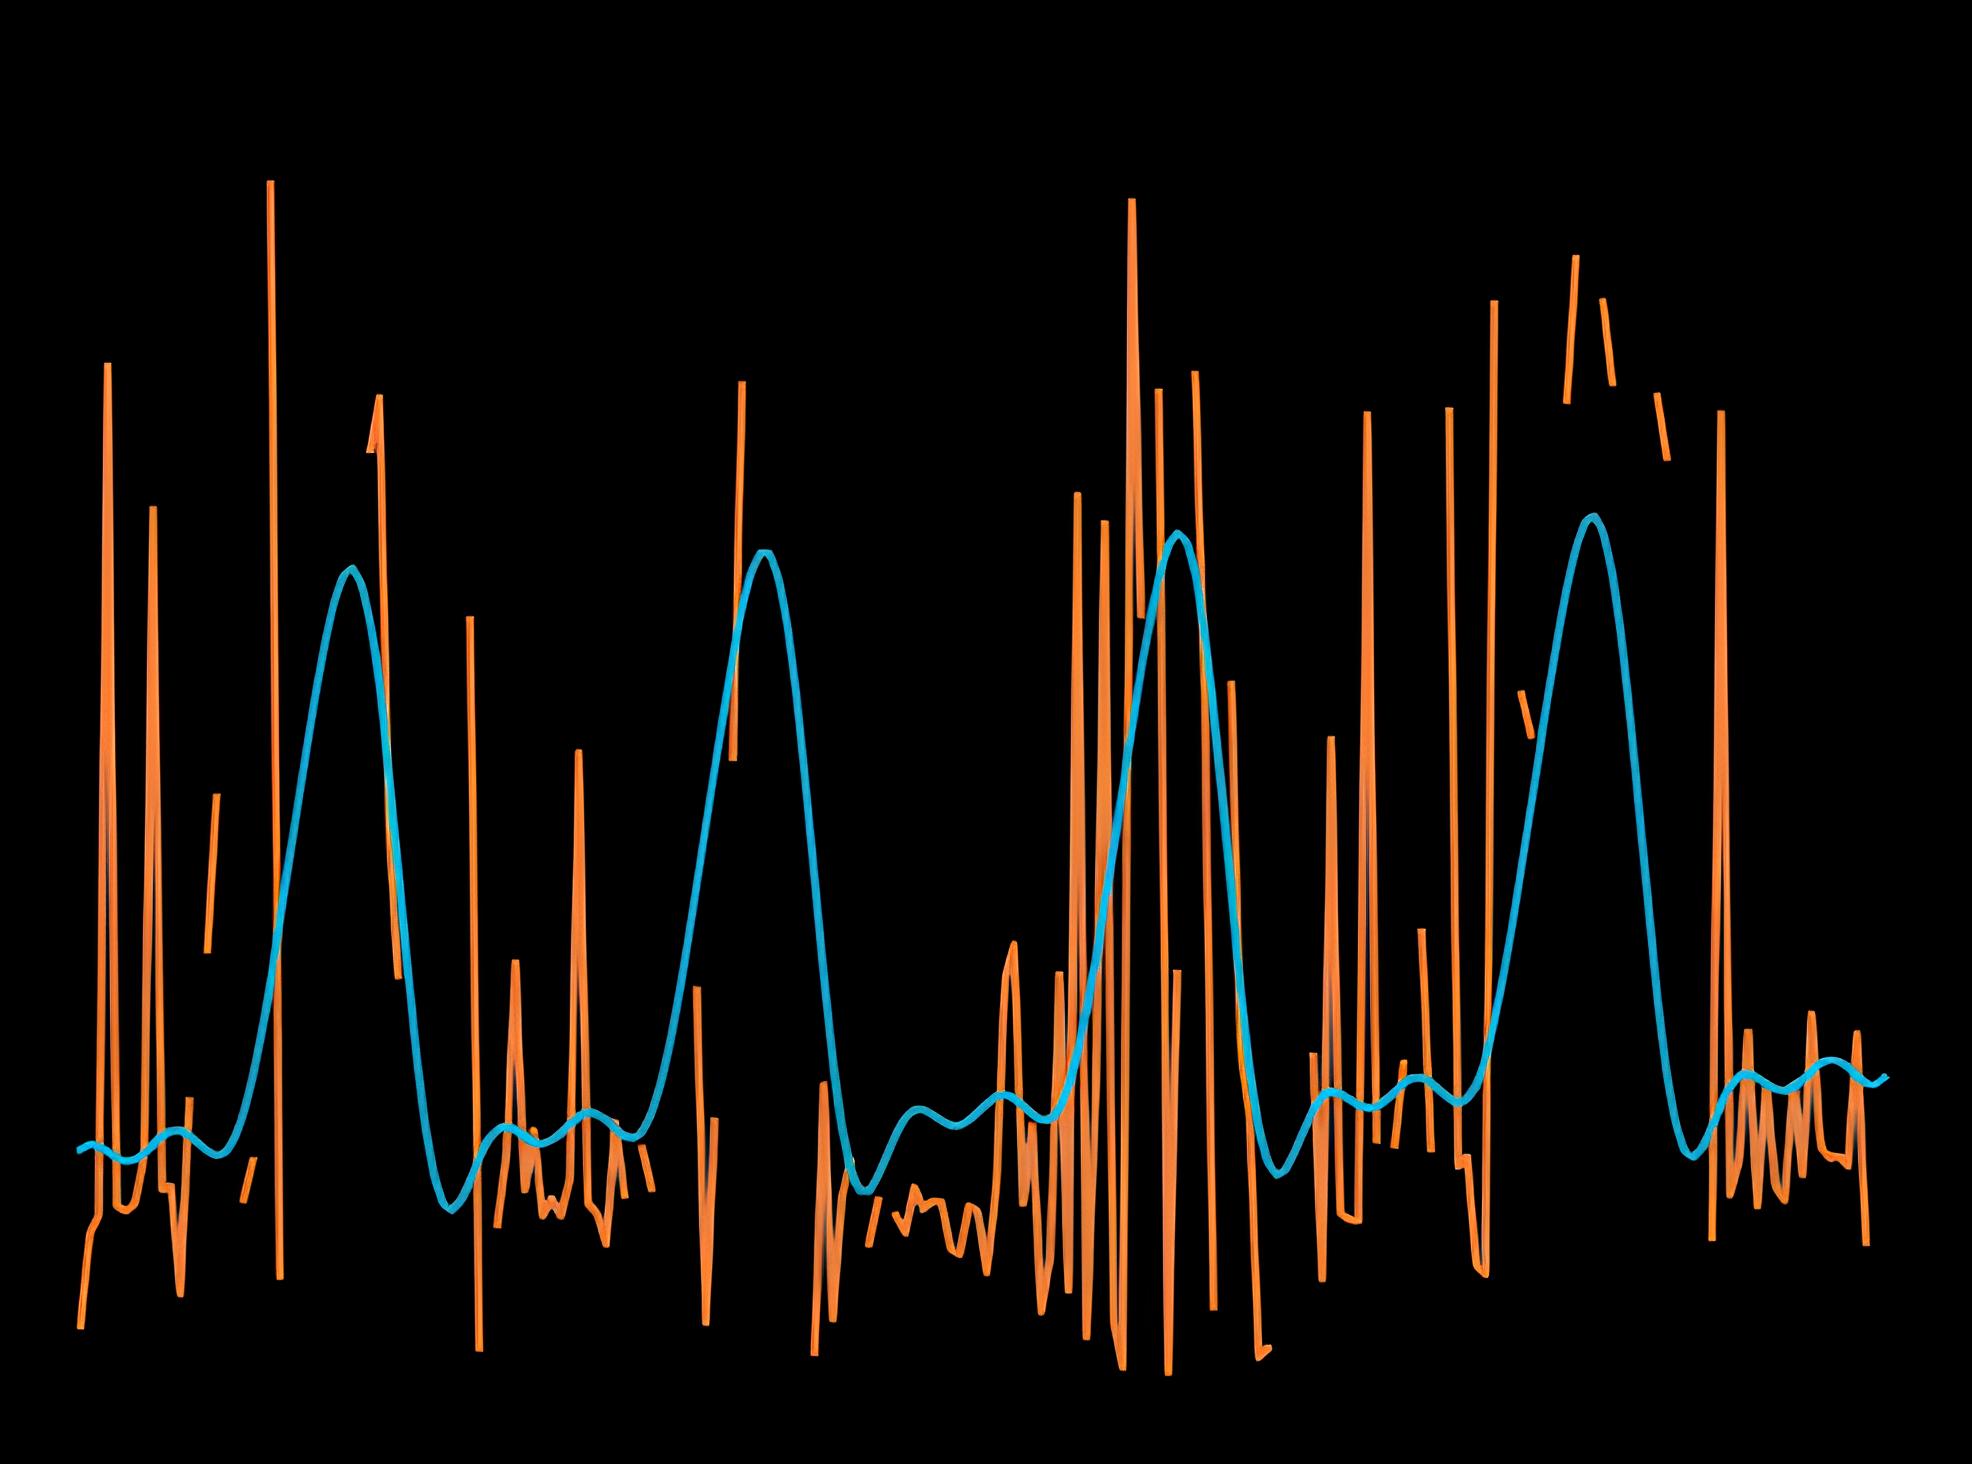
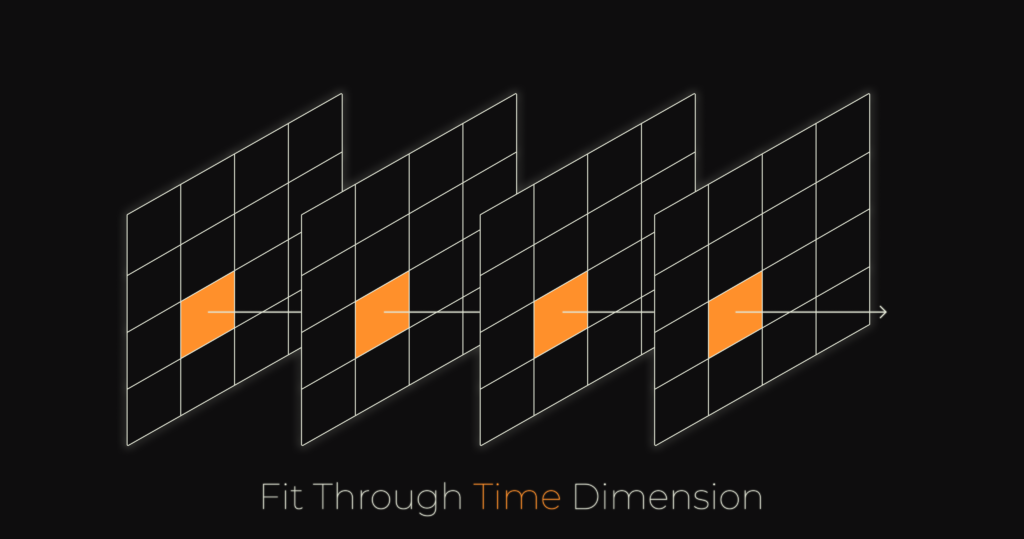
This shows a fit over about 5 years of Landsat data but only for a single pixel. In practice you must fit a series for every pixel in the area and store all of the parameters as a multidimensional array of data. This is where Tesseract comes in. Tesseract allows us to gather the data, split it into chunks, then efficiently process each of the chunks. Because Tesseract treats time as a first class citizen, we are able to accommodate many kinds of spatial, temporal and spatiotemporal analytics easily. In this analysis we perform more than 2.2 million fits across 200 time steps.
Because we are fitting a Fourier series to the data, we can use the least squares regression method to find the coefficients of the series. This is a simple linear algebra problem that can be solved using the following equation:

Where A is a matrix of the Fourier series, x is a vector of the coefficients and B is a vector of the transformed data. However, in the case of Landsat data, we cannot use a normal least squares regression because of missing data. Some time steps will be empty as the collection schedule for the satellites is not exact, and occasionally data will be missing due to clouds or other atmospheric conditions. In order to solve this problem we use a masked version of the least squares regression. For a detailed derivation of this method, see the Solving Least Squares Regression with Missing Data. The equation we will solve is:

Where A is the Fourier series matrix, B is the transformed data, M is a mask of the data, and X is the vector of coefficients. The mask is a matrix of 1’s and 0’s where 1’s represent valid data and 0’s represent missing data. This can easily be solved by numpy’s linalg.solve function.
See link below for demo: